XYScaleView : ValuesView : View : QObject : Object
 Extension
 Extension
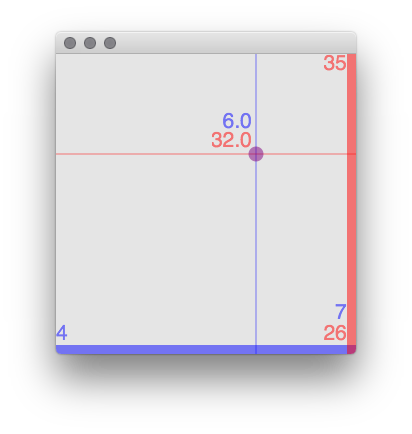
A simple X-Y plotter interface
Description
A View for interacting with two values on an X/Y plot. Each axis can be mapped to an independent ControlSpec, and the appearance can be customized.
This class also serves as a simple model for subclassing ValuesView, so you can use the class source file as a reference for designing your own UI to visualize and interact with multiple values.
Class Methods
XYScaleView.new(parent, bounds, specs, initVals, moveRelative: false)
Create a new XYScaleView.
Arguments:
| parent |
A Window or View, in which to embed this view. If |
| bounds |
A Rect describing the bounds of this view within its parent. If parent is |
| specs |
An Array of ControlSpecs that will control the range and warping of your values. If the array size differs from the number of initVals, it's assumed that values' index wrap around the array of specs. If |
| initVals |
An Array of initial -values when the view is first drawn. The size of the array determines how many values this view represents |
| moveRelative |
A Boolean specifying whether the position moves relative to the mouse or jumps to the value where pressed. |
Returns:
A XYScaleView.
Inherited class methods
Instance Methods
.fixSquare
.fixSquare = bool
Get/set the Boolean specifying whether the view canvas should be fixed to a square aspect ratio, or fill the full view.
Arguments:
| bool |
A Boolean. |
.moveRelative
.moveRelative = value
Get/set the Boolean specifying whether the position moves relative to the mouse or jumps to the value where pressed.
.background
.background = color
Get/set the background color, not to be confused with the -backgrnd drawing layer.
Arguments:
| color |
A Color. |
Drawing layers
.backgrnd
The drawing layer representing the canvas "background" (which isn't the same as the view's -background)
| property | default | description |
| show | true | show the backgrnd layer or not |
| stroke | false | stroke the boarder of the view or not (drawn last, on top) |
| strokeWidth | 2 | width of stroke, in pixels
unless |
| strokeColor | Color.black | color of the boarder stroke |
| fill | true | fill the background or not |
| fillColor | Color(0.9, 0.9, 0.9) | color of the background |
.range
The drawing layer responsible for drawing the range illustration of each axis.
| property | default | description |
| show | true | show the range layer or not |
| strokeWidth | 0.03 | width of stroke, in pixels
unless |
| strokeXColor | Color.blue.alpha_(0.5) | color of the x axis stroke |
| strokeYColor | Color.red.alpha_(0.5) | color of the y axis stroke |
| showRangeLabels | true | show the text of range bounds or not |
| fontName | "Helvetica" | font name string |
| fontSize | 0.07 | font size of the axis range text in pixels
unless |
.levels
The drawing layer responsible for drawing the current values of X and Y.
| property | default | description |
| show | true | show the levels layer or not |
| showPoint | true | show a point where the values cross on the plotter or not |
| pointSize | true | radius of the point in pixels
unless |
| pointColor | nil | color of the point
if |
| showCrosshairs | true | show crosshairs of the point location |
| strokeWidth | 0.01 | width of stroke, in pixels
unless |
| strokeXColor | Color.blue.alpha_(0.5) | color of the x value |
| strokeYColor | Color.red.alpha_(0.5) | color of the y value |
| showText | true | show the text of the values or not |
| fontName | "Helvetica" | font name string |
| fontSize | 0.07 | font size of the axis range text in pixels
unless |
Inherited instance methods
Examples
link::Classes/XYScaleView::